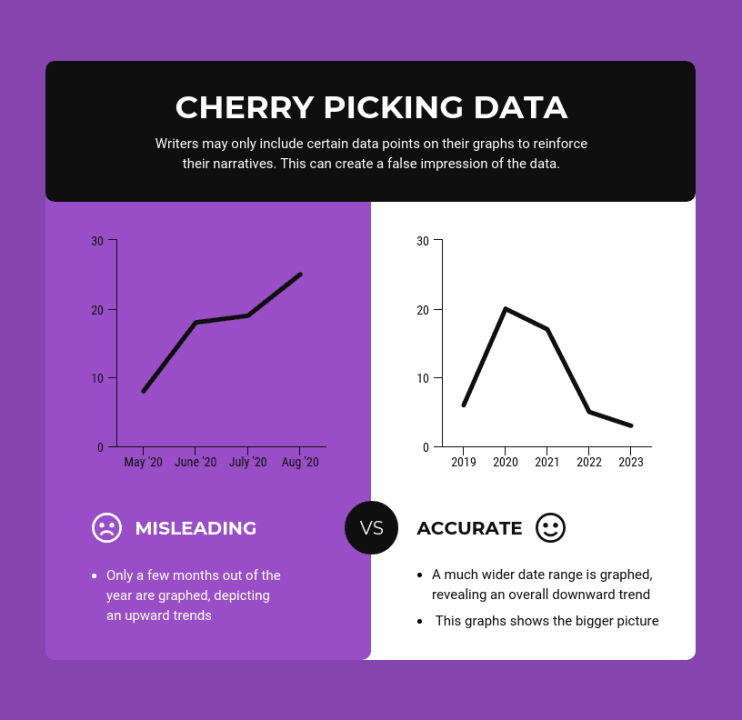
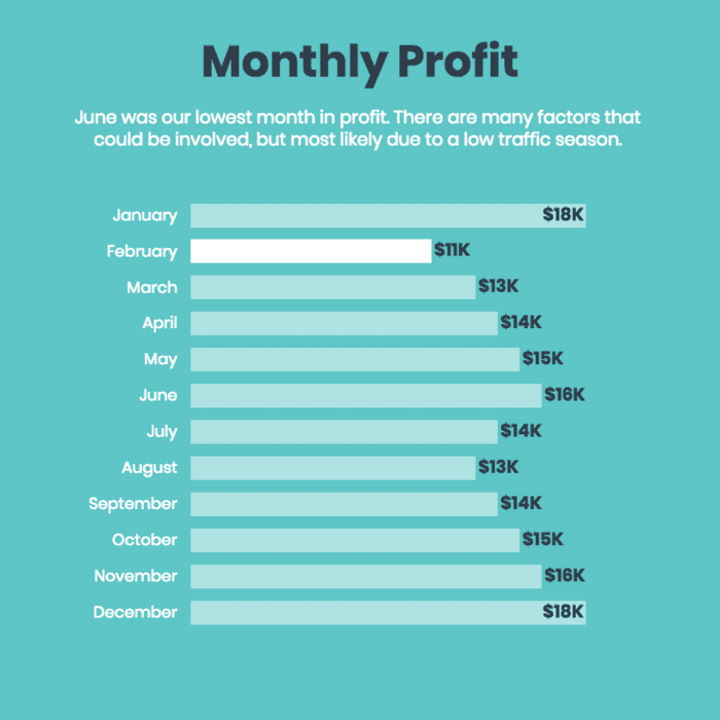
When gamers talk about numbers they’re often talking about a wealth of data that has been collected from a variety of sources, whether it be an online community or a physical survey. Statistical information is not going away anytime soon and the best way to show off your graphs as a gamer is by presenting them in a visually pleasing manner. This can be done on many different platforms but the easiest way is through an online graph maker. There are hundreds of these types of websites that claim to do all kinds of things with graphs, some that have their features and others that just provide a template for you to fill in data. These websites can be very helpful for users who are not as tech-savvy or for users who are just looking to have a quick synopsis of their data.
In this article, you will find easy steps on how to present gaming data.
Step 1: Find a template for your graph.
Countless websites provide tons of different types of graphs to choose from and you can often find these by just searching “graph maker” in Google. Most likely, one of your search results will include a line graph maker. If you have a problem looking for one yourself, visit Venngage.

Venngage
Step 2: Fill in the data in your graph creator.
The most time-consuming part of making a graph is usually just getting the data into the correct spot. Depending on your template, there will either be preset for you to fill in or blank spaces for you to work with. Fill in the appropriate data and make sure that all of it is accurate. You may check out line graph examples if you have a hard time starting your graph.
Step 3: Change the color scheme.
Several different color schemes come standard with most online graph makers, but you can also find websites that allow you to design your colors. These will often be called “color wheel” sites. This option gives you more freedom in choosing what colors look best on your graph without having to worry about how they will look with your background.
Step 4: Change the background.
A majority of graph makers will have a standard white background as the default, but others offer different colors or even textures as options. If you don’t like the color that comes with your graph template then it is easy enough to change that into a different color or texture just by clicking a button.
Step 5: Add a title.
Most online graph makers will have a space for you to put header text on your graph, but if not then there is usually an option for you to change the default header text into anything that you want. Titles are extremely important because they tell the reader what the information being presented entails.
Step 6: Add a legend.
Sometimes when you are looking at a graph, it can be confusing to figure out what each symbol or line represents in your bar graph maker, for example. Some online graph makers will have an option for you to add a legend that describes the different lines in your graph without having to label them specifically. The title of this step is ‘legend’ because these are usually referred to as a legend, but there are also options that allow you to add an extra text box for labels.

Venngage
Step 7: Change the font and add your company logo if you want.
You can also make line graphs visually pleasing. You can find countless different fonts to use when making a graph and most of them are easy enough to alter in size and color so that they look the way that you want them to. You may also include a company logo or other graphics by using tools such as Venngage.
Step 8: Email the final product to yourself.
Every good graph maker will have an option for you to email your finished graph. This is important in case you ever need to email it out to someone else or just want a backup copy on your computer.
Step 9: Save your finished product online.
A majority of online graph makers will provide an option for you to save your finished product online, but there are a few that require you to do it on your own. If the graph maker doesn’t have this feature then you can use a service such as Google Drive or Dropbox to upload your finished product.
Step 10: Use the image!
The whole point of making a graph is for you to use it as a visual aid in your work. A good rule of thumb is to use graphs whenever necessary but not overdo it by using them “just because”.
Bottomline
Now that you have all of these guidelines, it should be much easier to find a good graph maker. Of course, the best way to learn would just be by experiencing so remember not to be afraid to try out different online tools since they are usually free to use!


